

July 12, 2025
By Nick Routley
This was originally posted on our Voronoi app. Download the app for free on iOS or Android and discover incredible data-driven charts from a variety of trusted sources.
Key Takeaways
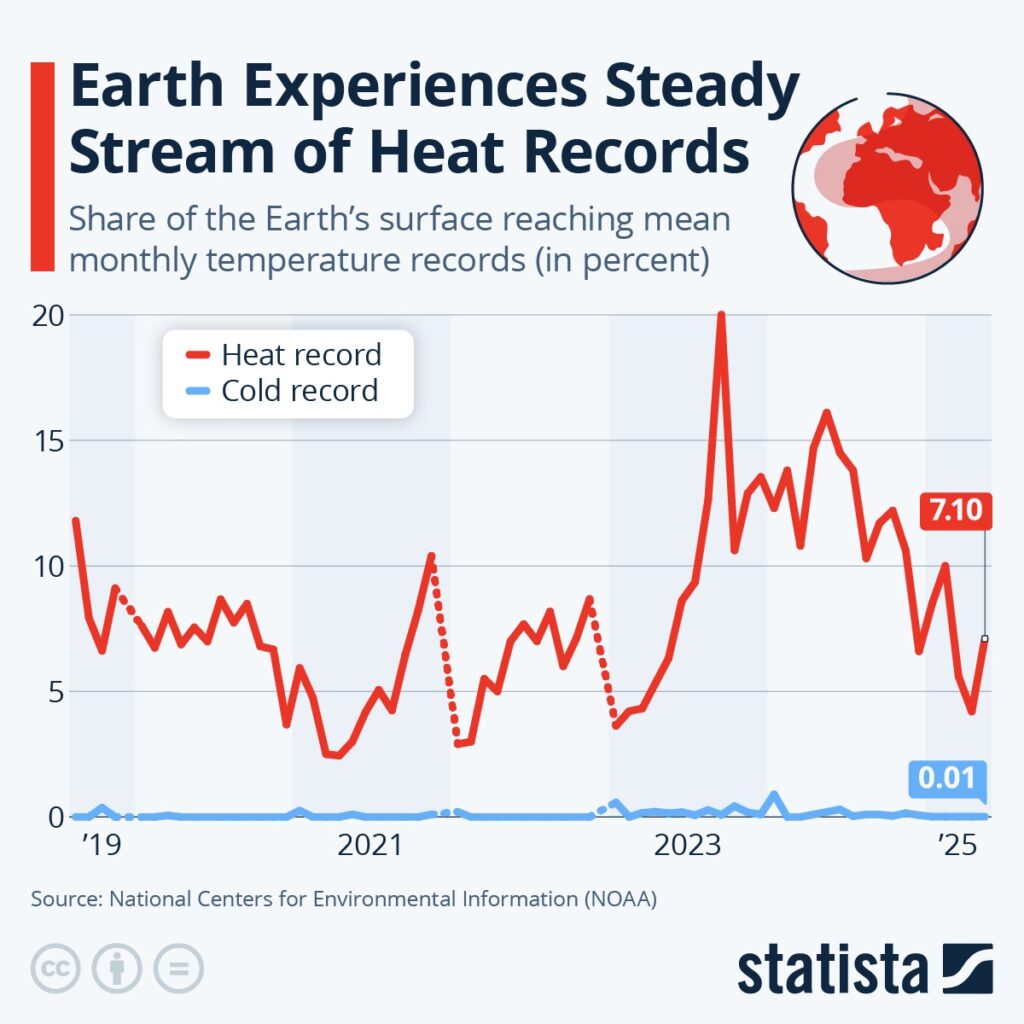
- In May 2025, over 7% of Earth’s surface experienced record-high monthly temperatures, continuing a trend of frequent heat records.
- Heat records now vastly outnumber cold records, a dramatic shift from mid-20th century climate patterns.
As temperature records shatter across Europe, the latest NOAA data shows a steady, global pattern of rising temperatures.
The chart above highlights how much of Earth’s surface hit new mean monthly temperature records in May 2025.
The data for this visualization comes from NOAA’s National Centers for Environmental Information and is visualized by Statista.
Record Heat Becomes the Norm
Over the past two decades, the frequency of new heat records has surged. In May 2025, about 7% of the planet’s surface broke local temperature records, a level that would have been extraordinary just a few decades ago.
By contrast, new cold records have become rare. For example, in January 2024, less than 1% of Earth’s surface set new cold records, highlighting the imbalance in climate extremes.
Regional Differences and Surprising Outliers
The record heat was not evenly distributed.
Oceans saw nearly 8% of their area reach new highs, while about 5.5% of land surfaces did the same. Hotspots included parts of the Arctic, Canada, West Antarctica, the Middle East, and Asia. However, some regions, such as India and Eastern Europe, experienced cooler-than-average conditions, showing that local weather can still buck the global trend.
Historical Perspective: A Dramatic Shift
Looking back, the balance between heat and cold records has flipped. In the mid-20th century, new cold records were more common, but since the 2000s, heat records have dominated nearly every month. The May 2025 result continues this trend, with the past three years seeing multiple months where 14–20% of the globe set new heat records.
Original:
https://www.visualcapitalist.com/earths-surface-heat-records-2025